


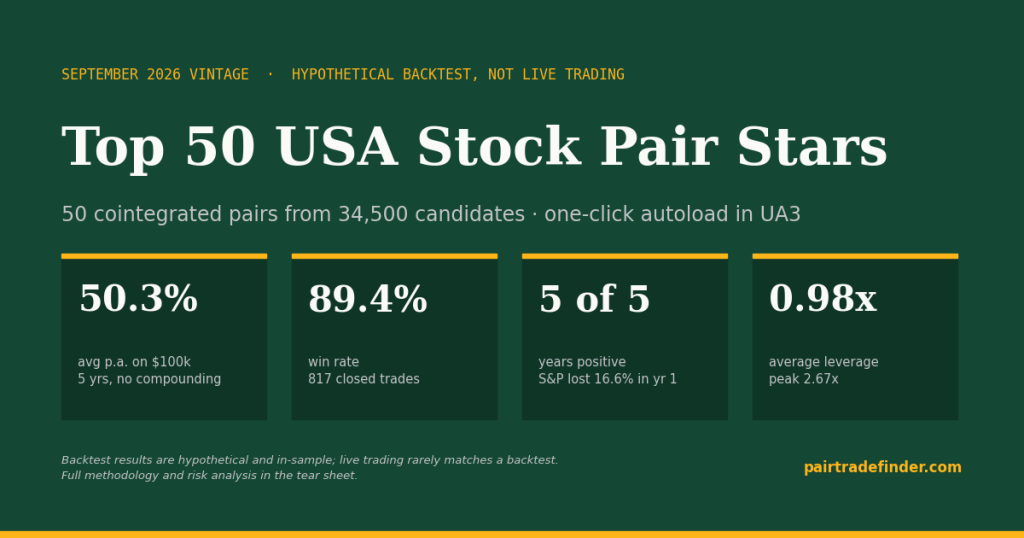
Every quarter we re-screen the entire U.S. mid-to-mega-cap universe for cointegrated stock pairs and keep the fifty that earned their place across a full five-year window. The September 2026 vintage of our Top 50 USA Stock Pair Stars is live in PairTrade Finder® Ultimate Alpha 3 today. This post explains how 34,500 candidate pairs became 50, what the fifty did in the backtest, and — because a backtest is only half a story — what the backtest cannot tell you.
What is a cointegrated stock pair?
Two stocks are cointegrated when the ratio of their prices is statistically stationary — it wanders, but it keeps coming back to a mean. Correlation tells you two stocks tend to move in the same direction on a given day; cointegration tells you the gap between them is anchored. That anchor is what a pairs trader sells when it stretches and buys when it snaps back.
Cointegrated stock pairs are the raw material of statistical arbitrage. A well-chosen pair is long one stock and short another in the same industry, so the position is roughly market-neutral: whether the S&P 500 rises or falls is close to irrelevant. What matters is whether the relationship between the two businesses holds. That is why the selection process matters more than any single backtest number.
How 34,500 candidate pairs became 50
The Top 50 is the output of six filters, applied in order. Each removes candidates that fail one test; only pairs that survive every stage are shipped.
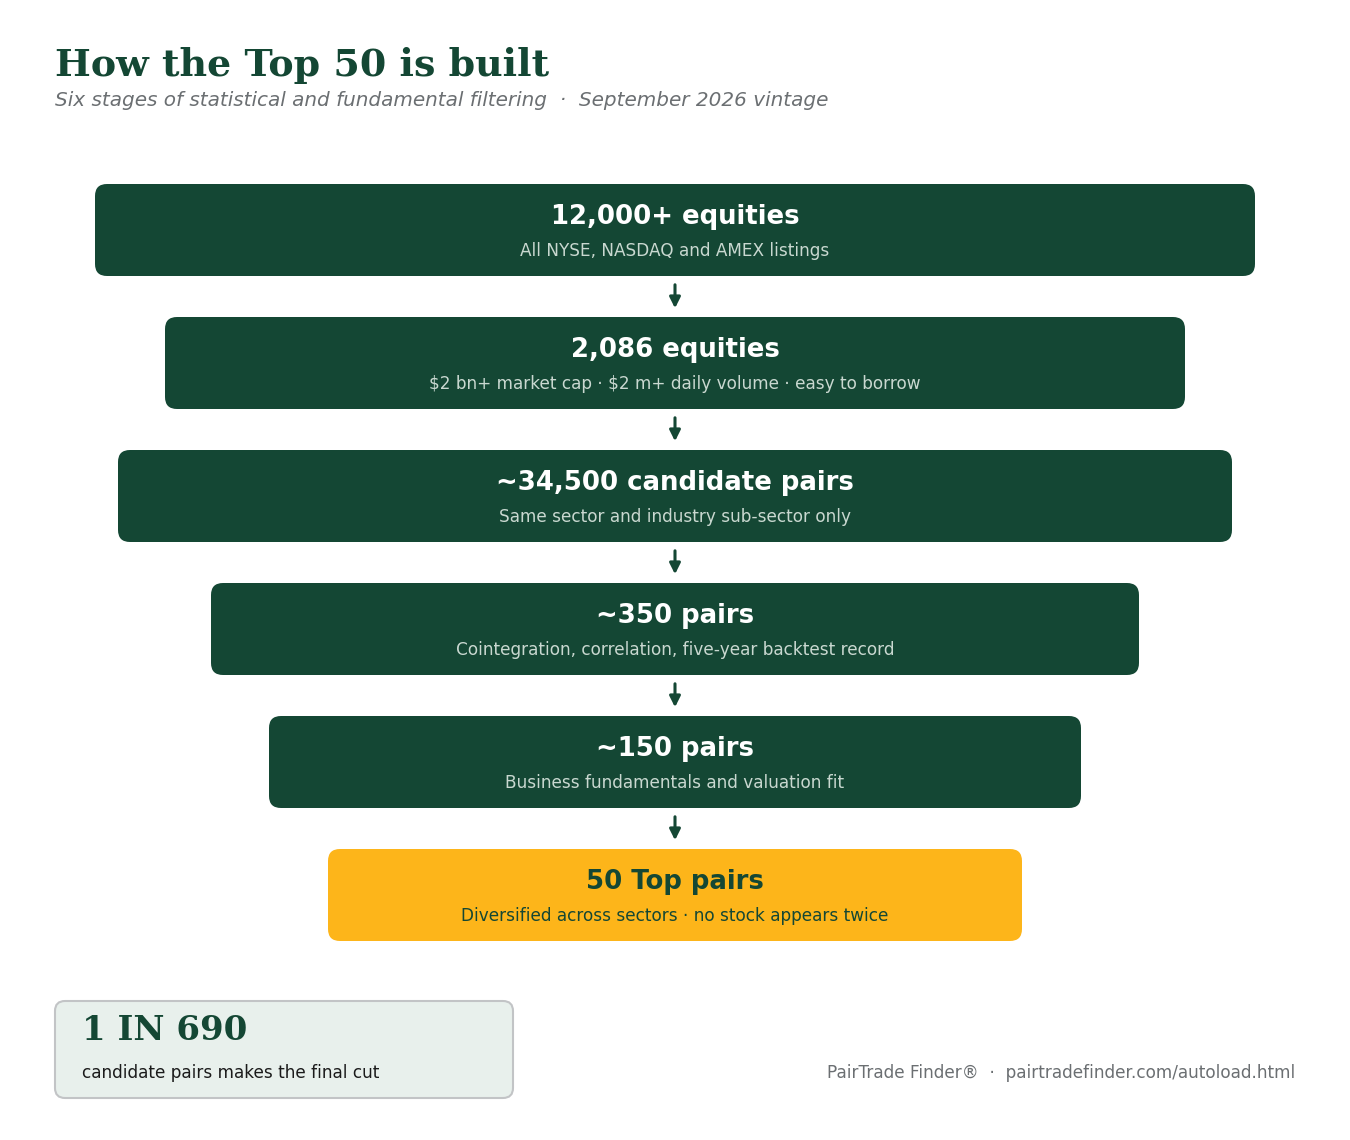
- 12,000+ listed equities — every NYSE, NASDAQ and AMEX listing.
- 2,086 equities — market cap above $2 billion, more than $2 million a day traded, easy to borrow. Illiquid and hard-to-short names are out before we start.
- ~34,500 candidate pairs — pairs are formed only inside the same industry sub-sector (144 of them; Regional Banks, Biotechnology and Application Software are the largest). Each pair is tested once; the signal decides which leg is long.
- ~350 pairs — pass an Augmented Dickey–Fuller cointegration test (p-value 0.10 or less), a 50%+ correlation target and a five-year layered backtest with minimum thresholds for trade count, average profit, win rate and drawdown.
- ~150 pairs — survive a fundamental review by hand. Statistics and a backtest can be passed by accident; every survivor is checked for a genuine economic link between the two businesses, with a preference for similar beta and market capitalisation.
- 50 Top pairs — ranked, then trimmed so that no stock appears twice and no industry dominates. One candidate in 690 makes the final cut.
The full parameter set — entry and exit stretches, lookbacks, commission assumptions, results filters — is on our Top 50 autoload page.
What is in the September 2026 book
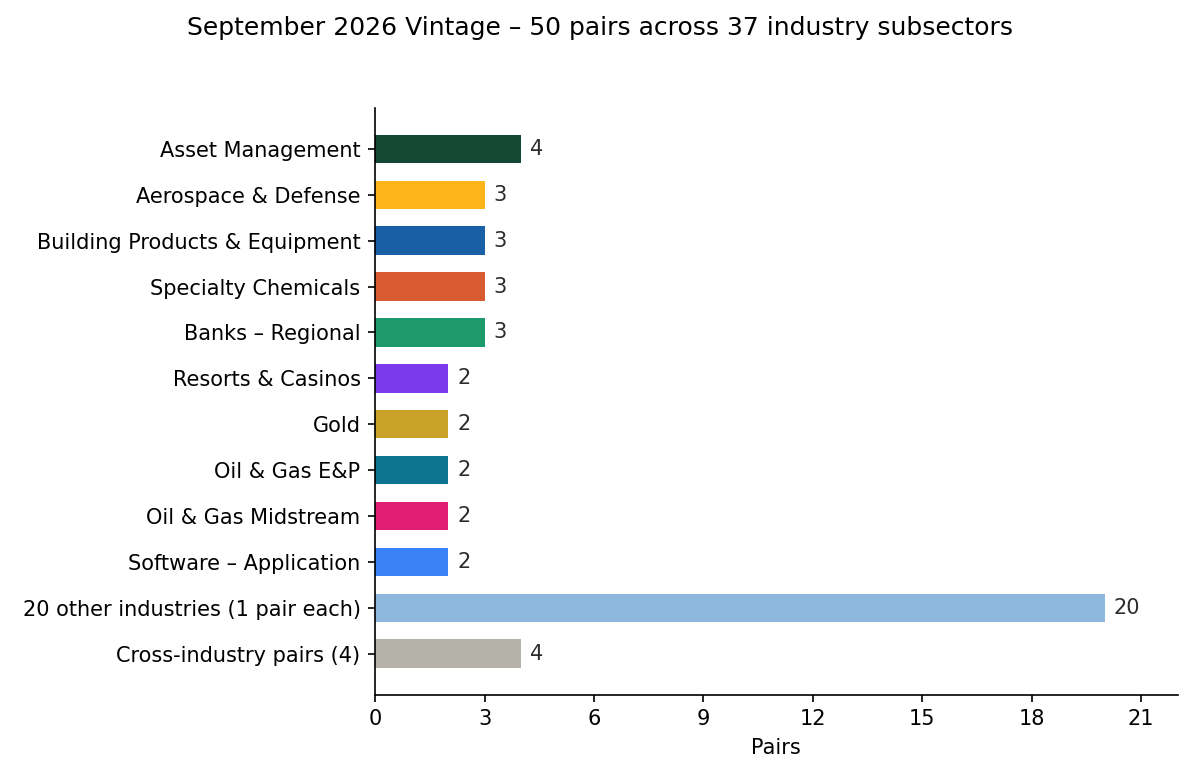
- 50 cointegrated stock pairs, 100 distinct tickers. No stock appears twice, so no earnings surprise or takeover can hit the book twice.
- 37 industry sub-sectors. The largest, Asset Management, holds four pairs; twenty sub-sectors contribute a single pair.
- 46 same-industry pairs and four deliberate cross-industry relationships that survived the same tests.
- Nine pairs carried over from the last three vintages; 41 are new to the book.
Three changes in this vintage
A five-year validation window, up from three, so every pair has been tested through the 2022 rate shock, the 2023 regional-bank stress and the 2024–25 rotation. The second entry layer tightened from 3.5σ to 3.25σ — under 3.5σ only about 15% of trades ever reached it; at 3.25σ it fired on 22% of trades over five years and 25% in the last twelve months. And a deliberate tilt toward moderate-to-high volatility pairs: a pair that swings wider between entry and exit carries more profit per trade, and with five years of history we can see how those wider swings behaved across several regimes rather than one.
What the fifty did in the backtest
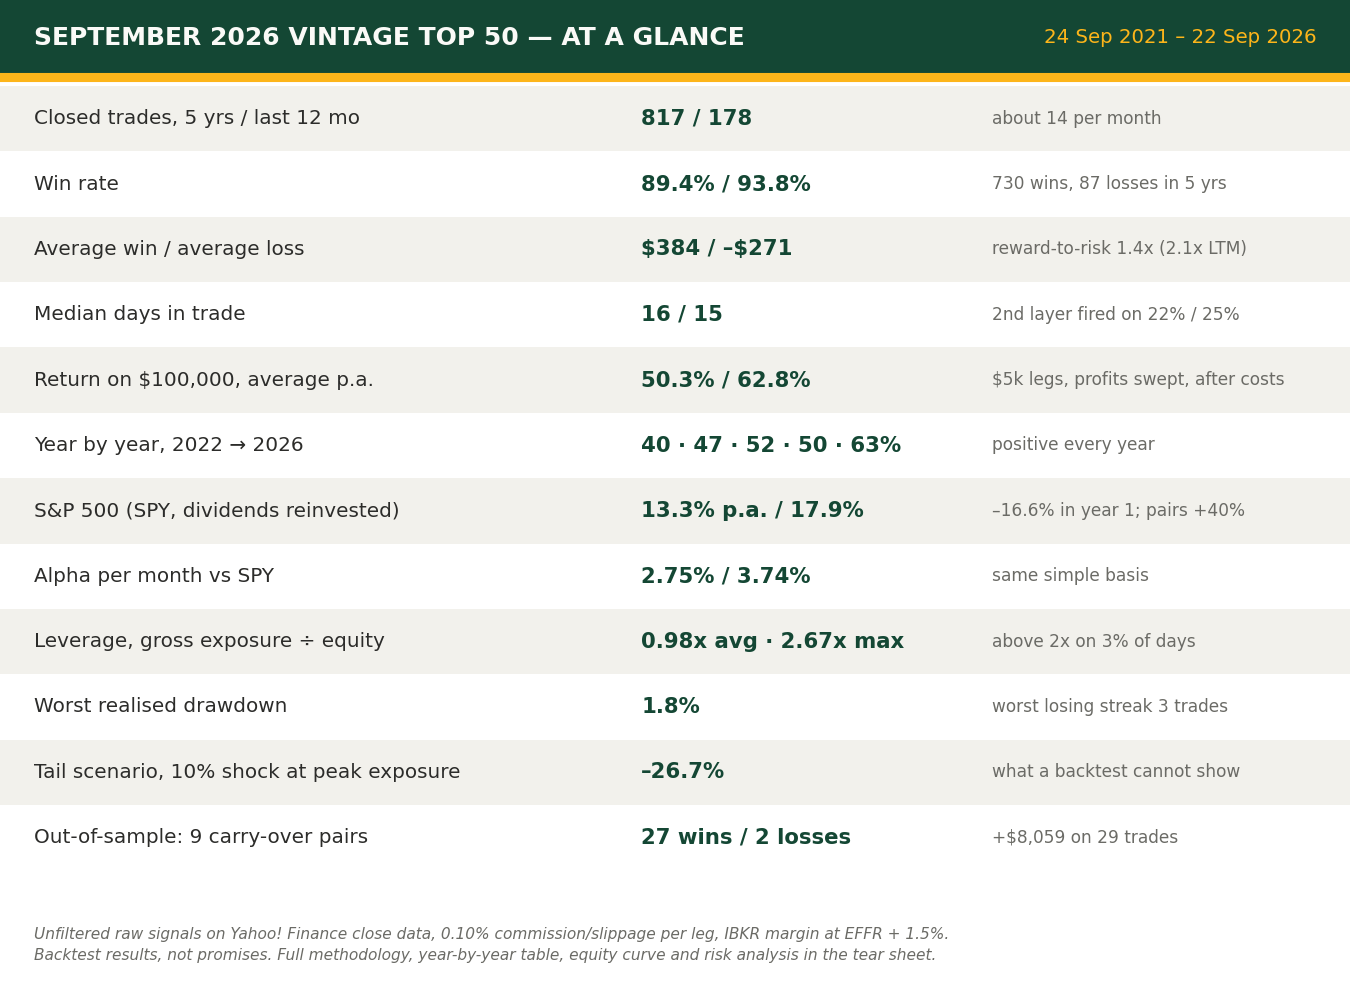
We measure the vintage the conservative way: a $100,000 account, fixed $5,000 legs (5% of equity; 10% when the second layer fires), profits swept out as they are made so returns never compound, after 0.10% per leg commission and slippage and IBKR margin interest. The S&P 500 comparison is buy-and-hold with dividends reinvested — it compounds; the pairs are not allowed to.
Year by year against the S&P 500
| Period | Top 50 return on $100k (simple) | S&P 500 total return |
|---|---|---|
| Sep 2021 – Sep 2022 | 40.4% | –16.6% |
| Sep 2022 – Sep 2023 | 46.6% | 19.2% |
| Sep 2023 – Sep 2024 | 51.7% | 34.6% |
| Sep 2024 – Sep 2025 | 50.1% | 18.1% |
| Sep 2025 – Sep 2026 | 62.8% | 17.9% |
| Five years | 251.6% (50.3% p.a. simple) | 86.3% (13.3% CAGR) |
The first row is the one to notice. The index lost 16.6% through the 2022 rate shock while the pair book made 40%. Every twelve-month period was positive, and the last was the best.
Leverage: essentially unlevered
Reconstructed daily from the entry and exit signals, gross exposure averaged 0.98x equity and peaked at 2.67x, exceeding 2x on 3% of days. Eight pairs were open on average, eighteen at most. Five years of margin interest came to under $5,000. Statistical arbitrage does not need leverage to produce these numbers; it needs discipline.
What the backtest cannot tell you
This is the section most pairs-trading marketing leaves out. On the closed-trade data the worst drawdown over five years was $1,811 — 1.8% of equity — and the worst losing streak was three trades. A 20,000-path Monte Carlo of the trade history cannot produce even a 5% drawdown. That number is true and it is also useless on its own, because a closed-trade series cannot see:
- Intra-trade mark-to-market. Every trade is booked at exit. Open positions were under water by more than the “maximum drawdown” many times.
- Correlated breaks. Cointegration relationships break together in a liquidity shock. A 10% adverse move across every open pair at peak exposure would cost about 27% of a $100,000 account.
- Single-name gaps. One leg gapping 30% on earnings or a takeover is a $3,000 hit on a two-layer trade — bigger than anything in the sample.
- Selection bias. These fifty are in the vintage because they behaved over this window. That makes every figure above an in-sample lower bound on risk, not an estimate.
The honest bracket, then, is 1.8% realised at one end and roughly 27% in a bad tail at the other. Size positions for the second number.
The one out-of-sample data point we have: nine pairs carried over from the last three vintages have been trading since their selection — 29 closed trades, 27 wins, 2 losses, average $278 against $294 in-sample. Small, but the edge did not decay.
How to load the Top 50 in Ultimate Alpha 3
Open UA3 → Upper Watchlist Toolbar → Autoload → “Autoload US Equities Pairs.” The September 2026 vintage downloads immediately and sits alongside the previous set. Every 15-day free trial includes the current vintage. Before trading a pair that is new to you, open its five-year history in UA3 and satisfy yourself that you agree with the selection — familiarity is part of the edge.
Start your free trial — load the Top 50 in one click
Full methodology, the equity curve, the leverage profile and the risk analysis are in the four-page September 2026 tear sheet (PDF).
Frequently asked questions
How many cointegrated stock pairs are in the Top 50?
Fifty pairs across 100 distinct tickers and 37 industry sub-sectors, selected from roughly 34,500 same-sub-sector candidates in the September 2026 screen.
Are the Top 50 stock pairs backtested or live results?
Backtested. All figures are hypothetical, in-sample results over the same five-year period in which the pairs were selected. Nine carry-over pairs have a small out-of-sample record since their earlier selection.
How often is the Top 50 updated?
Quarterly. Each vintage is re-screened from the full universe; typically most pairs are new and a minority carry over.
Do I need the paid version to get the Top 50?
No. The current vintage is included in every 15-day free trial of Ultimate Alpha 3.
NB: These example equities pairs are provided for informational and educational purposes only and should not be construed as personalized investment advice. It should not be assumed that trading using the parameters demonstrated by the Software will be profitable and will not result in losses. Any performance results prepared by www.pairtradefinder.com are not based on actual trading of securities but on a hypothetical trading account. Hypothetical performance results have many inherent limitations. Your actual results will vary. Please see our full Terms & Disclaimer.