


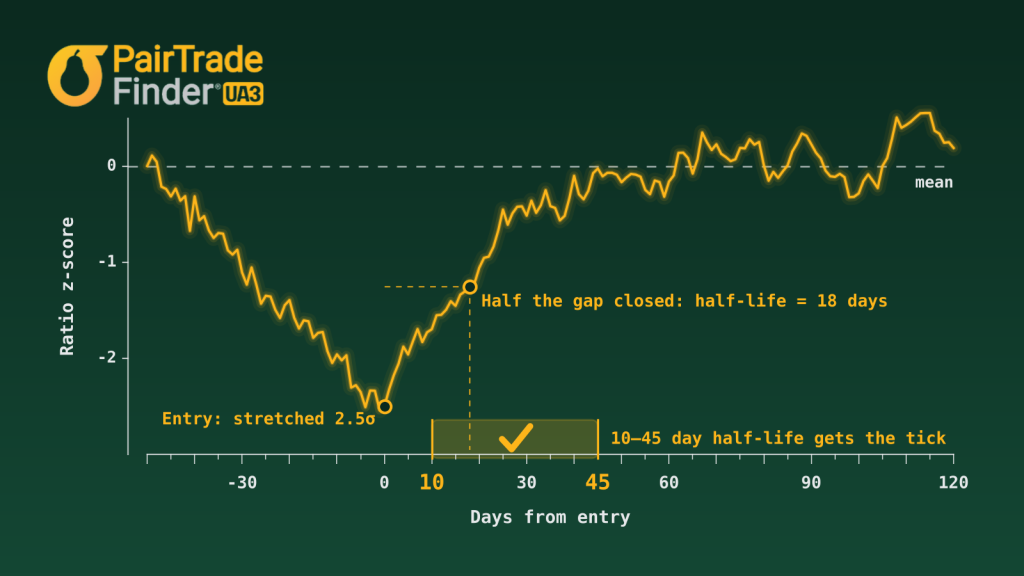
What is a pairs trading half-life?
When two related stocks drift apart, a pairs trader bets that the gap will close. The pairs trading half-life measures how long that usually takes. In other words, it is the number of days the pair needs, on average, to close half of the gap. A short half-life means the pair snaps back quickly, so your capital is tied up for days. A long one means a slow recovery and a long wait for your profit.
Our April post proposed a screen built on this measure. First, calculate the half-life over the last 90 trading days and over the last 252. Then set aside any pair where either reading runs past 45 days. That was a hypothesis, not a result. So one subscriber decided to find out whether it was true.
The test
David Gresens set out to test the pairs trading half-life rule on 1,185 pairs of economically related stocks and ETFs. He used the same Yahoo-adjusted daily prices PTF uses, from August 2022 to August 2026. He screened them in the order we intend for Ultimate Alpha 3: first for the relationship (same industry, correlation of at least 0.50, and cointegration of at least 0.90, which is a CADF p-value of 0.10 or better), and only then for half-life, calculated exactly as the April post described.
He also worked to a standard that much published research skips. The bands went on paper before he saw any results. Every half-life came from data available before the trade it governed. And when he lost his original trade file, he rebuilt the whole study instead of quoting numbers he could no longer check.
The floor matters more than the ceiling
Is 45 days special? No. Of the 555 pairs that passed the relationship screens, 70% had both half-lives under 45 days. That proportion rose smoothly as the ceiling went up, so 45 is not a natural break in the data. Whether it is the right ceiling is a separate question, answered below.
Does the pairs trading half-life filter improve trades, then? To find out, David replayed a stricter, stock-only population over the last two years: correlation of at least 0.60, and cointegration of at least 0.90 on both the 252-day and the 504-day windows. The measure to watch is the profit factor: total profits divided by total losses. A profit factor of 1.00 is break-even before costs, and 1.50 means a dollar and a half won for every dollar lost.
| Filter applied | Trades | Win rate | Profit factor |
|---|---|---|---|
| No half-life filter | 1,565 | 69.2% | 1.02 |
| Both half-lives 45 days or under | 1,189 | 70.0% | 1.04 |
| Both half-lives between 10 and 45 days | 391 | 75.2% | 1.84 |
On its own, the ceiling moved the profit factor from 1.02 to 1.04. Adding a floor did far more. Once pairs with half-lives under ten days were out, the profit factor rose to 1.84, and the pairs the band rejected underperformed. That result held in both halves of the period and under pair-clustered resampling. One caution, though: a higher profit factor on a quarter of the trades does not guarantee more profit in total. It means each dollar risked worked harder.
Why would a very fast pair be a bad trade? Partly statistics: on 90 days of data the half-life estimate is noisy, so the pairs at the very short end are often there by chance. Measure them again on the next window, and many of them move. The bigger reason is the market itself: a half-life of a few days means the spread barely persists. A 2.5-sigma stretch in a spread like that is usually noise or a one-day reaction to news. So by the time the trade has triggered and filled, the move has already reversed, and there is nothing left to capture.
Where the floor belongs
Holding the ceiling at 45, David moved the pairs trading half-life floor to see where the benefit begins. This is a separate cut of the data from the first table, so the trade counts differ. The pattern is the point.
| Band (days) | Trades | Win rate | Profit factor |
|---|---|---|---|
| 0–45 | 1,059 | 70.2% | 1.14 |
| 5–45 | 797 | 69.9% | 1.13 |
| 10–45 | 346 | 73.7% | 1.56 |
| 15–45 | 145 | 67.6% | 1.52 |
| 20–45 | 63 | 71.4% | 1.72 |
A five-day floor adds nothing. The improvement starts at ten days. Above that, raising the floor cuts the number of trades sharply for no consistent gain. The 15- and 20-day rows are small samples, so they are not evidence for a higher floor.
Why not raise the ceiling?
Perhaps 45 days was too strict, and we were discarding good pairs. David tested that too, with the floor fixed at ten:
| Half-life band (days) | Trades | Win rate | Profit factor |
|---|---|---|---|
| 10–45 | 394 | 71.1% | 1.39 |
| 10–55 | 446 | 70.2% | 1.23 |
| 10–65 | 474 | 70.3% | 1.23 |
| 10–75 | 493 | 69.6% | 1.18 |
No step up in the ceiling improved the results. Taken on their own, the trades a wider ceiling lets in lose money. In the 45–55 day bucket, for example, the average winner made $171 while the average loser cost $518, three times as much. That bucket holds only 52 trades, so David checked it on a second trade file. The answer was the same: the trades that a ceiling of 60 or 90 days admits lost money in every cut, whether both windows were relaxed or only the 252-day one. So the pairs trading half-life ceiling stays at 45.
A note on the three tables. They are three separate cuts of the data, not one study. The first was the run in mid-September; the second, a reconstruction for the floor test; the third, a full rebuild from the documented specification at the end of the month. The original run’s trade-level detail was not retained; it showed a profit factor of 1.84 for the 10–45 band. The rebuilt run from the documented spec yields 1.39, and we report both. The two runs were not on identical data, because the rebuild used a fresh price download, and without the original file the gap cannot be traced. The three cuts are not independent either: same source, same pairs, overlapping periods. What they share is the direction. In each one, pairs inside the band beat the pairs it rejects.
What we plan to add to UA3
We are looking to add a Mean Reversion Check to Ultimate Alpha 3’s screening. When both half-lives of a pair sit inside the band, the pair gets a green tick in your results. Four principles follow from David’s work.
- It flags, it does not filter. Pairs without the tick stay in your results. The study shows they are weaker on average, not worthless, so the decision remains yours. Expect fewer signals inside the band, roughly a third of the unfiltered rate. That suits a diversified book of pairs better than an active trader.
- The band is adjustable, with 10 to 45 days as the default. David’s results come from US stocks. However, PTF users also trade ETFs, futures and currencies, where the same pairs trading half-life band may not apply. If you reach a different view for your market, you will be able to set your own.
- It is an in-or-out test, not a score. David also tried ranking pairs by half-life, and the ranking had no relationship to profit. That is what a band looks like: too fast loses and too slow loses, so a straight-line score cannot see it.
- It runs after the correlation and cointegration screens, never instead of them.
Nothing you use today changes. We are targeting a beta release in early 2027, and David will have access to it first.
Caveats
This is historical simulation, not trading. No money was at risk. Live results rarely match a backtest once fills, costs and the trader’s own decisions are added. The study uses one data source: four years for the survival curve, about two for the trade replays. Across three runs, the pairs trading half-life band’s profit factor landed anywhere between 1.39 and 1.84. Past results promise nothing about the next sample.
PairTrade Finder® is software. Nothing in this post is investment advice or a recommendation to trade any pair.
Over to you
This is the first subscriber study to change a UA3 specification, and we would like it not to be the last. Between them, 8,000-plus PTF installations in 35 countries run more backtests in a month than we can in a year. So here is an open invitation.
If you have run PTF backtests, paper trades or live pairs and found something, send it: the settings, the period and what surprised you. If you would like to take a rule we have published and try to break it, better still. And if there is a feature that would improve your results, tell us. For example, a number you want on screen for every pair, or a gate you would add or remove.
Write to geoff@pairtradefinder.com with “Research” in the subject, leaving out anything personal. We read every submission. Work that holds up gets published here, credited as you choose and never without your sign-off. Contributors also get early access to the builds their work shapes. If you would like to test the Mean Reversion Check before release, say so in the same email.
About David
David Gresens is an independent systematic trader. His September 2026 study of 1,185 equity pairs identified the 10–45 day half-life band PTF has adopted as the default for the Mean Reversion Check planned for UA3. He previously developed systematic equity strategies at CloudQuant and now trades his own pairs book. Connect with David on LinkedIn.
The study was his own work, run on his own time, and every PTF user will benefit from it. We are very grateful. Thank you, David.