Continental Resources Inc. (CLR:NYSE) vs WPX Energy, Inc. (WPX:NYSE)
Profit of $800.03 in 30 calendar days on $10,000/leg. That’s 8.0% on nominal leg value and up to a 24.0% return on CFD margined equity (max 6:1).
Summary Profiles (Source: Yahoo! Finance, Company websites)

Continental Resources, Inc.explores for, develops and produces crude oil and natural gas properties in the north, south, and east regions of the United States.The company sells its crude oil and natural gas production to energy marketing companies, crude oil refining companies, and natural gas gathering and processing companies. As of December 31, 2016, its estimated proved reserves were 1,331 million barrels of crude oil equivalent (MMBoe) with estimated proved developed reserves of 602 MMBoe. Continental Resources, Inc. was founded in 1967 and is based in Oklahoma City, Oklahoma.
WPX Energy, Inc., an independent oil and natural gas exploration and production company, engages in the exploitation and development of unconventional properties in the United States. The company’s principal areas of operation include the Delaware Basin in Texas and New Mexico; the Williston Basin in North Dakota; and the San Juan Basin in New Mexico and Colorado. As of December 31, 2017, it had proved reserves of 436 million barrels of oil equivalent. The company was incorporated in 2011 and is headquartered in Tulsa, Oklahoma.
| ||||||||||||||||||||||||||||||||||||||||||||||||||||||||||||||||||||||||||||||||||||||||||||||||||||||||||||||||||||||||||||||||||||||||||||||||
Current Three-Year Backtest Using PairTrade Finder PRO Top 30 Settings
(Interactive Brokers datafeed)
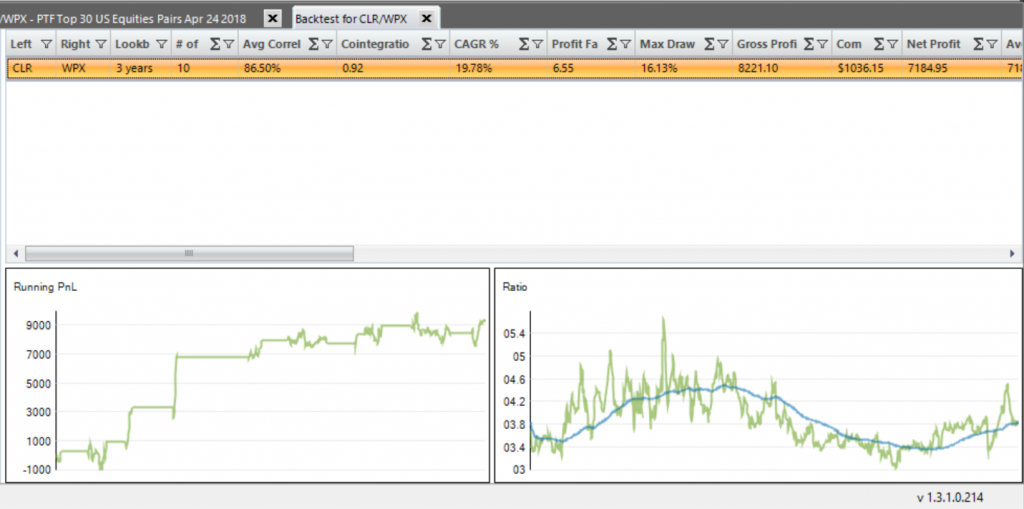
10 trades in 3 years. Avg. Correlation 87% (good), Cointegration 0.92 (excellent), CAGR 19.8%, Max DD 16.1% (excellent), Percent of Winning Trades 70% (ok, not great), Avg. Net Profit per Trade $719 (good). Average Days in Trade 29 days. Positive equity curve in the last 12 months. Good ratio line, lots of back and forth. Pair looks good.
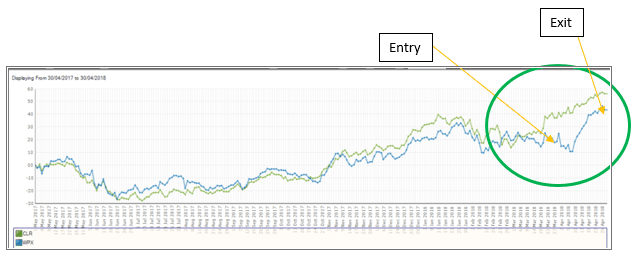
CDR/WPX Relative Performance Last 12 Months

Entry Trade Signal EOD 26 March 2018 at -2.37 sd (IB Feed):

Short Leg: Sell Short 170 shares of CLR at $58.90 = $9,987.97 net
Long Leg: Buy Long WPX 695 shares of SPN at $14.34 = $9,991.22 net
Check News:
CLR – On 21 Feb 2018 CLR announced quarterly results, over a month before the EOD Entry signal. No obvious news impacting fundamentals in the 10 days prior to the Entry Signal.
WPX – On 21 February 2018 WPX announced quarterly results, over a month before EOD Entry signal was triggered. No other obvious fundamental value affecting news in the 10 days prior to the EOD 26 March 2018 Entry Signal.
Check Earnings Announcements & Dividends:
CLR:
2 May 2018: Q1 2018 Earnings Announcement
CLR did not pay a dividend in 2016 and 2017, none announced for 2018.
- Results announcement of 2 May 2018 is 37 calendar days hence from Entry signal. Average trade length for CLR/WPX has been 29 days. We would consider this an acceptable window to have a mean reversion, however, every trader must have their own trading rule on this point.
WPX:
3 May 2018: Q1 2018 Earnings Announcement
WPX has no dividend announced for 2018 and did not pay dividends in the past two years.
- Results announcement of 3 May 2018 is 38 days hence from Entry signal. Average trade length for CLR/WPX has been 29 days. We would consider this an acceptable window to have a mean reversion, however, every trader must have their own trading rule on this point.
Pair Charts Covering Trade Period (IB Feed):
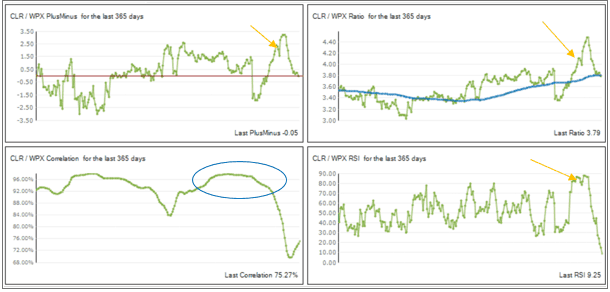
Ratio appears to be in a breakout at time of Entry Signal, above previous short-term resistance (a negative), ratio moving average is pretty flat though trending up slightly, in the direction of the ratio breakout (slight negative). Ratio has had a lot of crisscrosses over the moving average this year (positive). Correlation is very strong for the 90 days prior to the signal, above 90% (positive). RSI of Ratio at time of trade call was over 85, an extreme (positive), though does not indicate divergence (neutral).
Conclusion: The ratio breakout and the slight trending of the ratio MA in the direction of the breakout are negatives. Correlation and RSI are supportive. Setup is a toss-up, we would like to see a better entry, though we think the trade ranks as a possible entry because the Ratio MA is still quite flat.
Recent Volatility for Position Sizing Purposes (IB Feed):
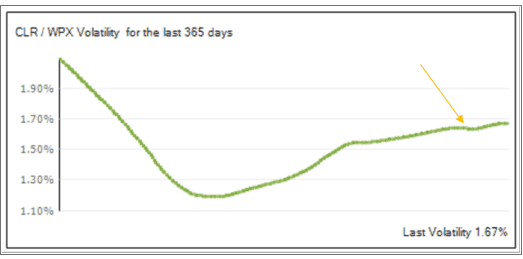
We would rate volatility as low to normal over last 12 months (range 1.2%-2.1%) and reasonable stable at time of Entry signal, about 1.65%. Suggests a standard position size.
RESULT OF TRADE
EOD Exit Trade Signal 25 March 2018 at -0.04 sd:


Short Leg: Buy to Close 170 shares of CLR at $64.44, Gross Result = -$941.80
Long Leg: Sell to Close 695 shares of WPX at $17.00, Gross Result = $1,848.70
Gross Result: $906.90, less commissions and slippage estimate and rounding errors of ($106.87) = $800.03.
Resulting Gross Profit of $800 in 29 calendar days on $10,000/leg. That’s 8% on nominal leg value and up to a 24% return on CFD margined equity (max 6:1).