


Filtering Event Risk in Modern Statistical Arbitrage
The Real Problem in Pair Trading Isn’t Signal – It’s Classification
Pair trading is often framed as a statistical exercise: identify a spread, measure its deviation, and trade the reversion. But in practice, the real challenge is not finding divergence – it is correctly interpreting it. This problem is where using sentiment scores in stock pair trading comes in to play.
A widening spread can mean one of two things:
- A temporary dislocation driven by liquidity or noise
- A structural repricing driven by new information
Traditional stat arb models – Z-scores, factor bias, half-life – are highly effective at detecting the presence of divergence. But they are fundamentally blind to its cause.
That distinction is where most of the edge lies.
When Mean Reversion Assumptions Break Down
Classical pairs trading implicitly assumes:
- Stationarity of the spread
- Stable cointegration
- Mean-reverting residuals
Idiosyncratic corporate events violate all three.
From a modelling perspective, what appears to be a two- or three-standard deviation move is often not a deviation at all – it is a shift in the equilibrium level. The spread is no longer mean-reverting around the same mean; the mean itself has moved.
This is the core failure mode of stat arb:
Mistaking a regime shift for a trading opportunity
A Real-World Example of Event-Driven Divergence
On October 27th, 2025 Trian Fund Management and General Catalyst launched a takeover bid for Janus Hendersen Group plc (NYSE:JHG) for $7.6 billion, or $49/share ALL CASH. JHG is a ticker in some of our favourite asset management sub-sector pairs (e.g. JHG/KKR).
The chart below shows the relative performance of JHG (green line) vs. KKR & Co., Inc. (NYSE:KKR) (red line) for the last year:
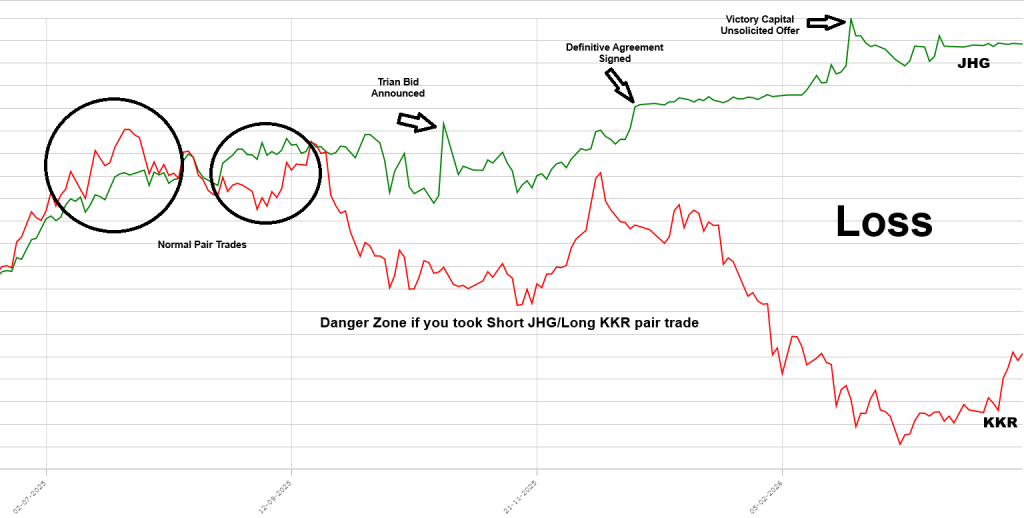
Notice the two normal-looking pair trades earlier in the year, which may have triggered and been profitable. Then, notice the large relative performance divergence in October 2025, and going forward. Note how KKR tanked as the overall US equity market also tanked due to the outbreak of war in the Middle East.
But notice how JHG did not tank, but stayed at or near the bid level, and even surged higher once an unsolicited counter-offer from Victory Capital emerged.
If you had taken a signal in that danger date range (see chart above), you would have been trapped when the bid(s) were announced – and forced to liquidate a losing trade to eliminate risk of further loss.
Had you “checked news” before entering the pair trade from any signal generated on or after 27 October 2025, you would have filtered out the trade and not been trapped.
This type of event is not an edge case. It represents exactly the type of trade that dominates drawdowns.
The Core Constraint: Idiosyncratic Risk Is Unhedgeable
A critical reality in stat arb is that once you enter a pair trade, idiosyncratic risk cannot be hedged out.
Even with perfect beta neutrality:
- You are long one company’s specific risk
- You are short another’s
- A shock to either leg will break the relationship
Diversification across many pairs, avoiding ticker concentration risk and small position sizing all help, but they do not eliminate all tail risk. A solid element of a more robust solution is pre-trade filtering.
The Corporate Events That Break Pairs
Certain types of events are especially dangerous because they alter forward expectations:
- Earnings surprises and guidance revisions
- Mergers, acquisitions, and takeover speculation
- Spin-offs and restructurings
- Special dividends and capital returns
- CEO changes, scandals, or governance issues
- Product failures, recalls, or major launches
- Regulatory actions, lawsuits, or fines
- Credit downgrades or liquidity stress
All of these introduce non-stationary shifts in valuation, invalidating mean-reversion assumptions.
Why Sentiment Scores Work – If Used Properly
This is where sentiment scores in stock pair trading intersect in a meaningful way.
Most retail approaches misuse sentiment by focusing on direction (positive vs negative). That is not the edge.
What matters is information intensity:
- How unusual is the sentiment relative to history?
- How much attention is the stock receiving?
- Is the effect isolated to one leg of the pair?
When sentiment is extreme, news volume is elevated, and the effect is asymmetric, the probability of a fundamental information shock is high.
Proposed Event Risk Filter in PairTrade Finder® Ultimate Alpha
This year’s development roadmap for PairTrade Finder® Ultimate Alpha 3 is being finalised, with a key upgrade focused on integrating event-aware intelligence directly into the signal engine.
At the core of this enhancement is the introduction of a News Shock Score (NSS) – a systematic way to detect when a price divergence is driven by information rather than mispricing.
The foundation of NSS is the application of Natural Language Processing (NLP) to financial news flows. NLP allows the system to process large volumes of unstructured text – news articles, press releases, and market commentary – and convert them into structured, quantitative signals. In practical terms, it enables PTF UA3 to measure not just whether news is positive or negative, but whether it is unusual, intense, and likely to reflect new information entering the market.
Here’s how we will look to implement sentiment scores in stock pair trading. Using this NLP layer, the NSS combines three key components:
- Sentiment extremeness (Z-score)
NLP-derived sentiment is normalised against its own history to identify statistically significant deviations—capturing when current news tone is unusually strong. - News volume spikes
The system tracks the intensity of coverage. Large, unexpected increases in article volume act as a proxy for information arrival and market attention. - Cross-sectional divergence between the pair
By comparing these signals across both legs, the model identifies whether the shock is idiosyncratic to one stock—precisely the condition that breaks pairs trades.
Rather than attempting to predict returns directly, the NSS functions as a regime validation layer. Its purpose is to answer a more fundamental question: are the conditions required for mean reversion still valid?
Updated Signal Stack for PTF UA3 Trading Signals
With the integration of the Event Risk Filter, the PTF UA3 pipeline evolves into a more robust, multi-layered decision framework:
- Z-score → identifies opportunity & direction (as UA3 does now)
- Technical bias stack → confirms that each leg’s chart structure supports the trade direction
- Event filter (NSS) → validates that the spread is not being driven by new fundamental information
- Half-life → estimates the expected speed of reversion (to be covered in the next blog post)
This enhancement represents a meaningful shift in system design. PTF UA3 is no longer simply generating statistically attractive signals – it is actively screening those signals for fundamental validity.
In other words, the system evolves from a signal generator into a signal validator – aligning far more closely with how institutional stat arb desks manage regime risk and avoid the most damaging category of trades.
Introducing the Event Risk “Traffic Light” System
To make this layer intuitive and actionable, PTF UA3 will surface event risk directly within trading signals using a traffic light framework:
- 🟢 Clean (Low Event Risk)
No unusual sentiment or news activity detected.
→ Statistical assumptions likely intact.
→ Trade with full confidence. - 🟡 Moderate Event Risk
Some elevation in sentiment or news flow, but not extreme.
→ Possible emerging information.
→ Proceed with caution (consider smaller size or stricter entry) or review all news to approve - 🔴 High Event Risk
Extreme sentiment, high news volume, and strong asymmetry detected.
→ High probability of fundamental repricing.
→ Avoid trade (likely non-reverting spread), or review all news to approve
This simple visual layer is powerful – it translates complex Natural Language Processing and statistical processing into an immediate, decision-ready signal.
How This Filter Improves Trading Performance
The impact is not incremental – it is structural.
Without event filtering:
- Non-reverting trades dominate the left tail
- Drawdowns are driven by regime breaks
- Sharpe is diluted by occasional large losses
With event filtering:
- The worst trades are removed before entry
- Win rate improves
- Losses become more controlled and predictable
- Alpha is cleaner and more consistent
In effect, the filter removes trades that violate the assumptions of the model.
Practical Trade-Offs
No filter is perfect, and there are important considerations:
- Over-filtering risk → fewer trades
- Latency → news may lag or lead price
- False positives → not all news is material
These are addressed by:
- Focusing on extreme signals only
- Combining multiple indicators (not relying on one)
- Using the filter as a high-threshold guardrail, not a blunt tool
- Manual review of news flow once an event risk has been flagged
From Statistical to Information-Aware Arbitrage
The integration of sentiment scores into stock pair trading marks an important evolution.
Instead of assuming all deviations revert, the system will now evaluate which deviations are likely to revert.
This approach aligns closely with institutional stat arb practices, where signal generation is only the first step – regime validation is equally critical.
Final Thought
The biggest losses in pairs trading do not come from bad signals – they come from applying good signals in the wrong regime.
By incorporating sentiment scores and event detection into the decision process, PTF UA3 ensures that trades are based on mispricing, not information.
And that distinction – between noise and reality – is where durable edge lives.
Start a free trail of PairTrade Finder® Ultimate Alpha 3 today!
To your financial success,
Geoff & the PairTrade Finder® Team
