


And What the Death of the Pattern Day Trader (“PDT”) Rule Means for You
Most trading careers don’t end in a dramatic blow-up. They end in attrition: an equity curve that grinds sideways with violent swings, a strong month handed back to one overnight gap, an edge quietly eaten alive by spreads and slippage, and a trader burned out from staring at screens for outcomes that never compound.
If that pattern is familiar, the usual question — “which style suits my personality?” — is the wrong one. That’s the amateur’s question. The professional question is colder: which trading style is structurally built to deliver a compounding monthly return, with drawdowns shallow enough that one bad streak doesn’t wipe out the base — and your confidence with it?
The verdict, up front: for the large majority of serious retail traders, swing trading wins — and it wins hardest when the swing is structured as a market-neutral pair trade system. The post-PDT “freedom” now being marketed to small day-trading accounts is, for most, an invitation to lose capital faster. The evidence, the maths, and a real, logged track record follow.
What Is Day Trading? Why Do Most Day Traders Lose?
What is day trading? Opening and closing the same position within a single session, carrying no overnight exposure. Day-to-day stock trading, in the popular phrasing. The mechanics of typing in to AI “how to day trade” are now a phone call and a few document uploads away. Boom, there’s your new margin account, a data feed, a chart, and a setup that aims to extract a small move in minutes or hours. Clean in theory.
The reality for most traders is governed by three structural killers, and they remain despite whatever day trading strategy you run:
- Cost drag is brutal. Even at zero commission, you pay spread and slippage on every fill. Thirty round-trips a week is 1,500+ ticks a year in friction alone. Your edge has to be enormous just to break even — and most edges aren’t.
- Cognitive load breaks discipline. Dozens of micro-decisions a session produce decision fatigue, and decision fatigue produces the revenge trade at 3pm that gives back the morning’s work. High frequency feels productive. It usually isn’t.
- Execution is the whole game. Sub-second routing, tight effective spreads, and bracketed orders separate a system that works on paper from one that works in real money. Most retail day trading strategies fail right here.
The academic verdict is uncomfortable and unambiguous. The most rigorous study on the achieved results of a large sample of day traders is probably “The cross-section of speculator skill: Evidence
from day trading.” done by Barber, Lee, Liu and Odean (2013).
Their analysis of more than 360,000 Taiwanese day traders from 1992 to 2006 shows roughly 84% lost money, with the median return about –8.7%, and fewer than 1% earning consistent positive returns net of fees. Costs and behaviour explain almost all of it. This isn’t a quirk of one market; U.S. studies show loss rates north of 90%.
The Pattern Day Trader Rule Is Dead (4 June 2026). Does It Make a Difference?
For 25 years, “day trading for beginners” in the U.S. meant one rule above all: under FINRA Rule 4210, four or more day trades in five business days made you a “pattern day trader”, requiring you to hold $25,000 in account equity at all times.
As of 4 June 2026, that’s gone. The SEC approved FINRA’s amendment (Regulatory Notice 26-10), eliminating the pattern-day-trader designation, the trade count, and the $25,000 floor — replacing them with risk-based intraday margin. Now, your account must simply hold equity commensurate with the exposure you actually carry, in real time. Brokers have until 20 October 2027 to fully transition.
For access, this is a genuine liberalisation. For outcomes, it’s a trap dressed as freedom. The $25,000 barrier was the one thing standing between a small account and high-frequency churn. The structural killers — cost, psychology, edge — are untouched. A trader with $5,000 can now day trade freely. Most will simply lose the $5,000 faster.
What Is Swing Trading?
What is swing trading? Holding a position across multiple sessions — typically two days to a few weeks — to capture a swing in price between inflection points. You carry overnight and weekend risk by design.
A sound swing trading strategy rests on three pillars: an identifiable swing (momentum continuation or mean reversion at a statistical extreme); position sizing set against the worst credible overnight gap, not just intraday volatility; and a pre-defined exit (trailing stop, fixed R-multiple, exit stretch threshold, time stop, or thesis-breakdown). Drop the exit framework and swing trading quietly becomes investing by accident.
The classic question “what are the best stocks to swing trade?” has a boring, correct answer: liquid names (1M+ average daily volume), ATR in the 1.5%–5% band, optionable where you want defined risk, and spread across sectors so ten “different” trades aren’t secretly one factor bet. The real edge is in how you structure the swing, not in chasing whatever’s hot.
And here’s the swing trader’s number-one frustration, named plainly: the overnight gap that erases a week of gains. There are only two real defences: i) size every position small and spread the book across many uncorrelated names, and ii) strip out market direction with a pair. Neither makes you bulletproof, and the next section is honest about exactly what a pair can and cannot protect you from.
The Real Goal, Plus the Maths That Get You There
The goal, restated: a significant, compounding, absolute monthly return with shallow drawdowns. That’s a geometric target, and geometric compounding punishes drawdowns asymmetrically:
Drawdown |
Return required just to recover |
| –10% | +11.1% |
| –20% | +25.0% |
| –30% | +42.9% |
| –50% | +100.0% |
| –75% | +300.0% |
A 30% hole doesn’t need a 30% recovery, it needs +43% on a shrunken base just to get back to flat. A 50% drawdown demands a double. This mathematical reality is why so many “profitable” traders still make no money: one bad streak guts the compounding base, and the curve never recovers the ground.
The message any prospective consistently profitable trader MUST internalise is that drawdown control isn’t a comfort feature, it’s the dominant variable in long-run compounding. As Warren Buffet likes to say “Rule 1: don’t lose money. Rule 2: never forget Rule 1.”
Which reframes the entire comparison. The question isn’t “which style wins more often?” it’s “which style’s architecture supports the lowest sustainable drawdown for the highest sustainable monthly compounding rate?”
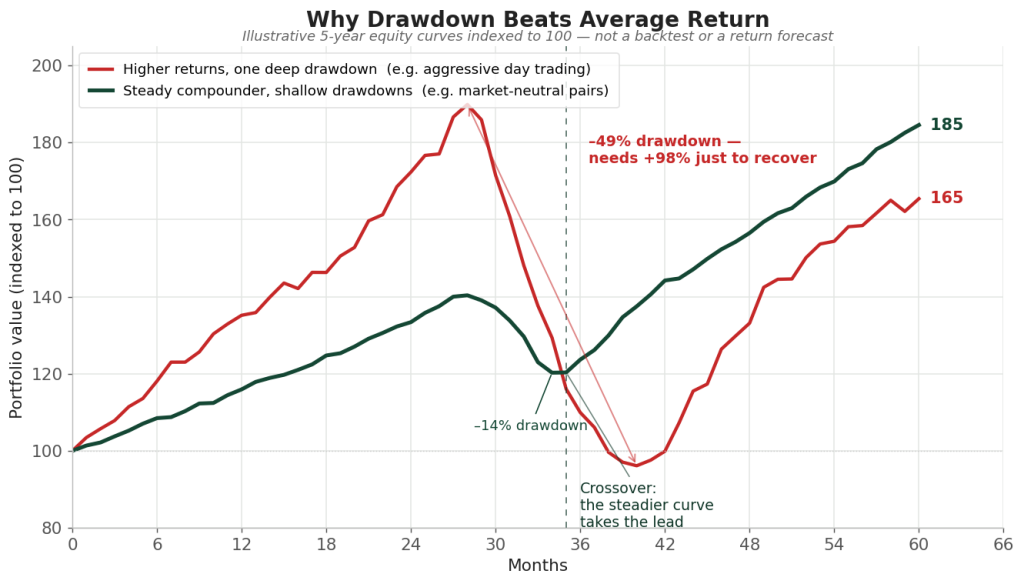
Figure 1.Two illustrative 5-year equity curves indexed to 100. The aggressive curve (red) posts higher, more volatile gains and a higher peak, then takes a single ~50% drawdown and spends years clawing back. The steady curve (green) never draws down more than ~14% and finishes ahead. Illustrative only. Not a backtest or a return forecast.
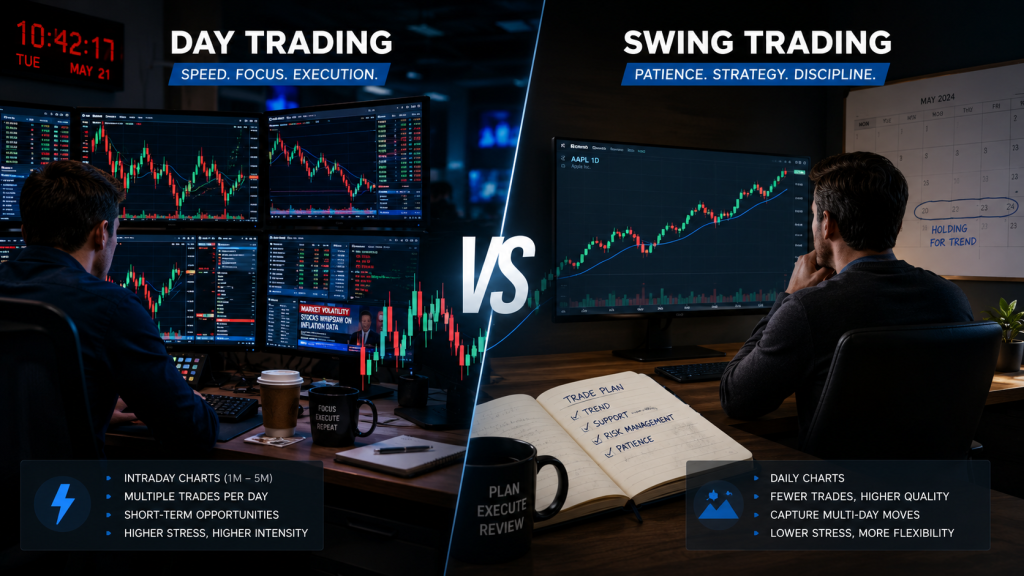
Let’s Summarise: Day Trading vs Swing Trading
Metric |
Day Trading |
Swing Trading |
| Holding period | Minutes–hours | Days–weeks |
| Overnight gap risk | None | Present (managed via sizing + pairs) |
| Trades per week | 20–100+ | 2–10 |
| Time commitment | 4–8h, screen-attached | 30–90 min/day |
| Per-trade R-multiple | 1–2R typical | 3–10R achievable |
| Cost as % of return | High | Low |
| Behavioural error rate | High (frequency × live-loss stress) | Lower (fewer decisions) |
| Empirical retail success | <1% consistently profitable net of fees | Materially better |
| Market-neutral overlay fit | Poor | Excellent |
| Compounding-friendliness | Conditional on flawless cost + discipline | Structurally higher |
The two decisive rows are the bottom three. Day trading forces you to trade your P&L in real time, and therefore emotions peak exactly when losses are live, and the cost structure means you need a huge edge before you’ve covered friction. Swing trading inverts both: fewer, larger-R trades pay spread once, and you sleep on positions instead of reacting to every tick.
Most traders fail not from bad systems but because they optimise for excitement or activity instead of the maths of survival. Swing trading forces better behaviour. Market-neutral pairs force an even better risk profile. How?
Why Swing Trading Stock Pairs Wins
By trading the relationship between two stocks rather than the direction of the market.
That is what a swing trading stock pair is: you buy one stock and short-sell a closely related one, usually two companies in the same sector that have historically moved together, in roughly equal dollar amounts. You then hold the position across a multi-day to multi-week swing. You are no longer betting that the market rises, or even that either company does well on its own. You are betting on the spread between them: that an unusually wide divergence converges back toward its historical norm. The market can climb, fall, or chop sideways, but what moves your P&L is whether your long out-performs your short, not where the index goes.
Trading a relationship instead of a direction is a small change in mechanics and a wholesale change in risk. Map the solution directly back onto the pains we opened with.
Market-direction risk → neutralised. A pair trade is long one security and short a correlated one in roughly equal dollars, so net market exposure sits near zero. When the whole market gaps down e.g. with a tariff shock, a rate surprise, both legs fall together and the spread, your actual P&L, barely moves. That removes systematic risk, the largest single source of directional-trading drawdown.
Single-name risk → diversified, not eliminated. What it does not remove is idiosyncratic risk, and any honest operator says so plainly. A large overnight gap in one leg e.g. a surprise earnings miss, an FDA knock-back, a fraud headline, a shock bid, will hit one side only, and it can hurt badly. No pair structure can engineer that away; anyone who tells you it can is selling something. The defence is portfolio construction, not magic: small position sizes, a large number of pairs spread across many sectors, and no ticker concentration. Run that way, any single-name gap is a small, survivable fraction of the book — noise, not catastrophe. The risk is managed down to a diversifiable term, and can be either a positive or a negative gap. Over the long-term, the noise ought to self-cancel somewhat.
The cost bleed → minimised. A pair held over a multi-day convergence pays its spread a handful of times, not the dozens an intraday book pays chasing the same move. Your edge survives to compound.
The screen burnout → gone. Sixty to ninety minutes a day to scan, size, and manage. Forget about the eight hours glued to a ladder.
We believe that with systematic risk neutralised, idiosyncratic risk diversified down, costs minimised, we approach is the closest thing the markets offer to a holy grail of trading. The system and approach can yield a return stream that compounds across regimes because the directional risk has been engineered out and the single-name risk has been spread thin.
But don’t just take our word for it. Let’s see real-time results.
The Proof: A Real-Time, Fully-Logged Stock Pair Swing Trading Track Record
The architecture above has been run forward in the real world.
The PairTrade Finder® “GH” portfolio has been traded in real time in an Interactive Brokers paper-trading account (DU3656439) from 1 January to 17 August 2025 – 7.5 months – with commissions and slippage modelled, and every trade logged and auditable. Forward, out-of-sample performance with full frictions, not a backtest and not curve-fitted hindsight.
The headline: +17.4%, against +10.8% for the S&P 500 (SPY) and +3.1% for the First Trust Long/Short Equity ETF (FTLS) — a fair, actively-managed long/short benchmark — over the same window.
2025 |
PTF GH Beta |
SPY |
FTLS |
| Jan | +3.0% | +2.8% | +2.6% |
| Feb | +1.9% | –1.3% | –1.7% |
| Mar | +3.9% | –5.6% | –3.3% |
| Apr | +1.9% | –0.9% | –0.8% |
| May | +1.5% | +6.3% | +3.1% |
| Jun | –0.6% | +5.1% | +1.5% |
| Jul | +1.1% | +2.3% | +0.7% |
| Aug (to 17th) | +3.7% | +2.0% | +1.2% |
| YTD | +17.4% | +10.8% | +3.1% |
We want you to focus on the key characteristic of this approach. Not the headline return, but the drawdown. Here is the same period on the metrics that decide whether a strategy compounds or bleeds:
PTF GH Beta |
SPY |
FTLS | |
| Maximum drawdown | –3.6% | –18.8% | –11.5% |
| Annualised volatility | 13.4% | 23.2% | 12.3% |
| Sharpe (annualised) | 1.74 | 0.67 | 0.14 |
| Sortino (annualised) | 3.82 | 1.12 | 0.23 |
| Correlation to PTF GH | — | 0.56 | 0.39 |
(Sharpe and Sortino computed against a 4% p.a. risk-free rate.)
Read those numbers against the thesis of this piece:
- A maximum drawdown of just –3.6% while the S&P 500 fell –18.8% and the long/short ETF fell –11.5%. Crucially, this window contained the April 2025 tariff-driven crash, the moment SPY collapsed (see the chart below). The portfolio barely registered it. That is the shallow-drawdown claim proven through a live stress event, not asserted. It is also the diversification defence working exactly as described: no single overnight gap was large enough relative to the book to do real damage.
- Positive in seven of eight months, the one down month a –0.6% scratch. That is the compounding-monthly-return, the other half of the goal.
- Correlation to the S&P 500 of just 0.56 – confirmation the market-neutral construction is doing its job. These returns are not a levered bet on a rising market.
- Risk-adjusted, it isn’t close: a Sortino of 3.82 versus 1.12 for SPY means the portfolio produced its return with a fraction of the downside volatility, which is the only volatility a compounding trader actually cares about.
As importantly, average month-end gross leverage for the PTF Portfolio over the period was 1.44x, peaking near 2x. That level is modest for a market-neutral book, where low net exposure conventionally supports higher gross. There is no hidden leverage juicing these numbers.
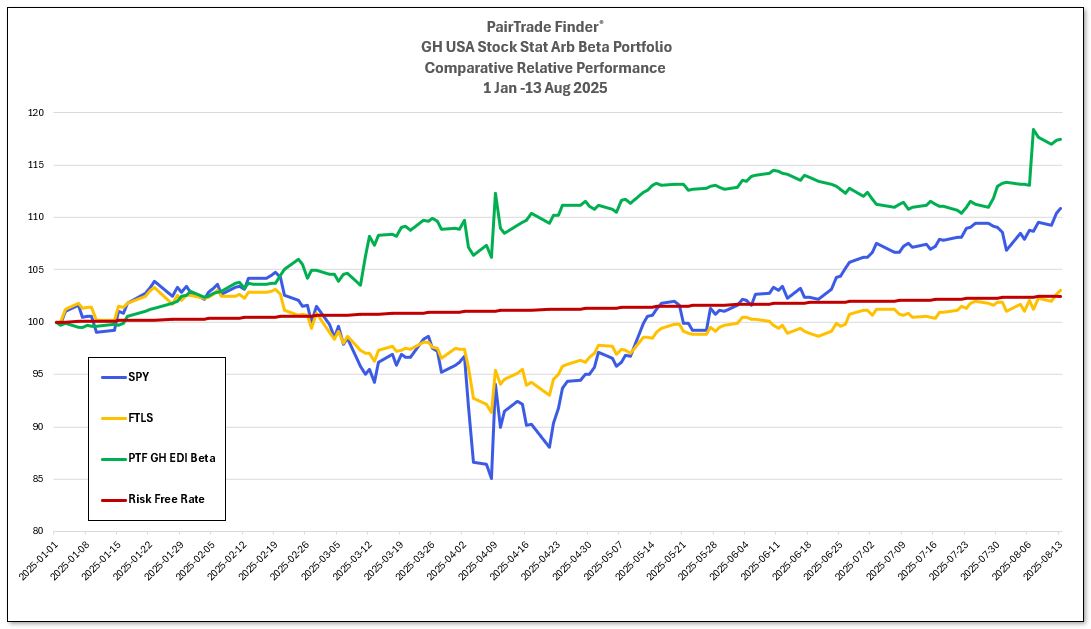
Figure 2. GH PairTrade Finder® portfolio (green) vs SPY (blue) and FTLS (orange), rebased to 100, 1 Jan – 17 Aug 2025. Note early April: as SPY plunges on the tariff shock, the green line holds its level. Interactive Brokers paper-trading account DU3656439.
Honest Caveats
Two, stated plainly. Day trading is the right tool for a genuine minority. Traders with a tested, statistically significant intraday edge, professional-grade execution, and the psychology to act under live-loss stress without flinching. If that’s you, the post-PDT environment is the most open it’s been in a generation. For everyone else – almost everyone searching “how to day trade” – the structural odds are stacked against the strategy, and removing the PDT rule doesn’t change that.
And on the record above: 7.5 months is a track record, not a lifetime, and it is paper-traded, albeit forward, in real time, with realistic frictions and a complete audit log. It is evidence the architecture behaves as the theory predicts, including through a real crash. It is not a promise. Past performance, simulated or real, is never indicative of future results.
The Bottom Line
Swing trading, built on market-neutral pair structures, is the superior architecture for the goal that actually matters: compounding monthly returns with drawdowns shallow enough to survive a bad streak. Lower costs preserve the edge. Fewer decisions cut the blow-ups. Market-neutral construction removes the directional risk that drives the deepest drawdowns. And disciplined sizing across many uncorrelated names manages down the single-name risk that the stock pair strategy can’t remove. The track record above is that thesis, run forward through a real market crash, and it held.
This is precisely why we built PairTrade Finder®. Our platform, Ultimate Alpha 3 (UA3), integrates with Interactive Brokers and puts the statistical-arbitrage toolkit that hedge-fund quants once monopolised into the hands of serious retail and small-institutional traders. Check out its real-time pair scanning, cointegration and correlation analytics, and configurable signals for multi-session swing pairs — backtesting, optimisation, and live execution in one workflow.
If the case for swing trading stock pairs we have made in this article resonates with you – and the real-time paper trading track record appeals to you – the next step is to trial the platform and see the full logged track record for yourself.
Explore PairTrade Finder, request a trial, and review the complete, fully-logged track record at pairtradefinder.com.
Geoff S. T. Hossie holds the Chartered Market Technician (CMT) designation and is CEO and owner of PairTrade Finder®, published by Equilibria Technologies Ltd., London.
Performance shown is from a real-time paper-trading (simulated) account at Interactive Brokers (no. DU3656439), traded forward from 1 January to 17 August 2025 with commissions and slippage modelled and all activity logged and auditable. It is not real-money trading and not a backtest. A 7.5-month record is not a substitute for a long-term one, and past performance — simulated or real — is not indicative of future results. Nothing in this article is investment advice or a recommendation to trade any security or strategy. Trading carries substantial risk of loss.
References
- Barber, Lee, Liu & Odean (2014), The cross-section of speculator skill: Evidence from day trading, Journal of Financial Markets, 18, 1–24.
- Barber, Lee, Liu & Odean (2009), Just how much do individual investors lose by trading?, Review of Financial Studies, 22(2), 609–632.
- FINRA Regulatory Notice 26-10 (April 2026), Margin Standards — Amendments to Rule 4210.
- SEC Release No. 34-105226 (14 April 2026), order approving the Rule 4210 amendment.
