


Why We Keep It Simple (On Purpose)

From time to time, experienced traders reach out and ask:
“Why doesn’t PairTrade Finder® use a Kalman filter to calculate dynamic hedge ratios?”
It’s a fair question. Kalman filters are widely used in quantitative finance and are often presented as a more advanced way to trade pairs.
So this post explains our thinking clearly.
PairTrade Finder® is designed to capture most of the statistical edge—without the complexity that often reduces real-world performance.
In practice, as a rule we seek to target a platform that delivers 80% of the benefit of institutional grade models with around 20% of the complexity. That trade-off is intentional and grounded in how strategies behave outside of backtests. So what about Kalman filters then?
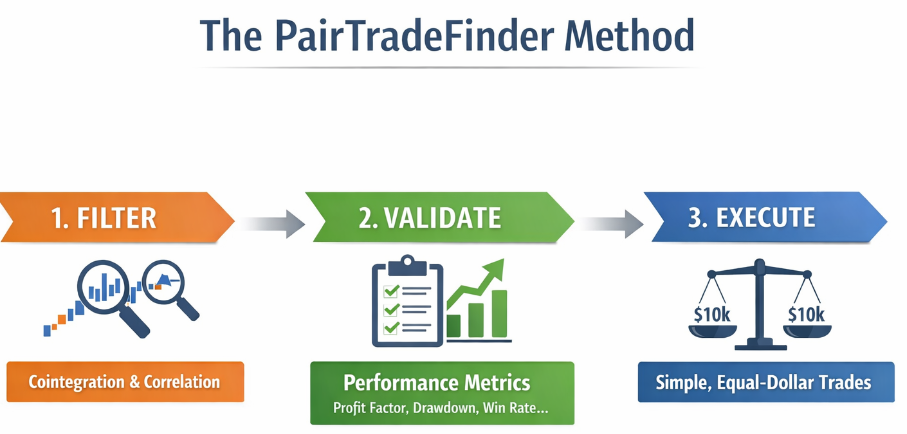
Step 1: Finding High-Quality Pairs
Before any trade is suggested, PairTrade Finder® filters pairs using two key tests:
Cointegration (ADF Test)
This checks whether two assets have a stable long-term relationship.
In simple terms:
- Prices may drift apart in the short term
- but tend to come back together over time
This is the foundation of mean-reversion trading.
We perform two ADF tests: a Spot Cointegration test and an Average Cointegration test.
The Spot Cointegration test measures cointegration (Left Close – Hedge Ratio* Right Close) looking back over 730 calendar days (two years). The Hedge Ratio used is simply the Left Close/Right Close averaged over the last 730 calendar days (all adjusted for splits).
The Average Cointegration Test is where PairTrade Finder® calculates the Spot Cointegration value for the pair over each of the last 730 calendar days, and takes the average of that number.
The Average Cointegration Test is used in the backtester to identify pairs with a stable cointegration. The Spot Cointegration is used both in the backtester and Watchlist to measure whether the current cointegration is valid.
Correlation: both Mathematical and Fundamental Business Factors/Valuations
Correlation ensures the two assets:
- move closely together in the short term
- respond similarly to market conditions
These tests are crucial to help avoid pairs that look good statistically but are difficult to trade in practice.
At PairTrade Finder®, we measure both the mathematical correlation to ensure it is high, but we also carefully scrutinise the fundamental correlation of the two businesses. For example:
- are they in the same industry sub-sector?
- do the same supply chain factors impact them similarly?
- do they operate in the same markets with the same products?
- do they have similar leverage ratios, dividend payouts and beta?
- does the market apply similar valuation metrics to them?
By ensuring pairs meet these fundamental criteria, we are seeking to match stocks that will react to market regime changes in a very similar way, and hence would mitigate the effects of skipping a Kalman filter test. Remember, our average trade duration is only 17 days – and we update our pair universe every 90 days or so.
Why Both Matter
- Cointegration provides the long-term anchor
- Correlation provides the short-term tradability and the underlying trade logic for why these two companies will mean revert
Together, they help identify pairs that are both statistically valid and practically usable.
Step 2: Validation. Real Trading Performance
Beyond statistical relationships, PairTrade Finder® also evaluates how pairs have behaved in practice.
This includes metrics such as:
- profit factor
- maximum drawdown
- number of trades
- average profit per trade
- win rate
These are not used to over-optimise or curve-fit strategies. Instead, they act as a reality check, helping filter out pairs that may look statistically sound but have not traded well historically.
This step ensures that selected pairs are not just theoretically valid, but also practically tradable.
Step 3: Simple, Robust Execution
Once a pair passes these filters, PairTrade Finder® keeps execution deliberately simple:
- Uses the price ratio (P₁ / P₂) as the signal
- Applies a z-score to identify extremes
- Trades with equal-dollar exposure (e.g., $10k long / $10k short)
This creates a balanced trade without needing constant recalculation of position sizes. Remember, the majority of our pairs are very beta-similar and business-factor-similar, so dollar-neutral legs are also close to beta neutral.
Our subscribers also filter signals based on recent news to ensure no fundamental-value-shifting idiosyncratic events have occurred to generate the signal (e.g. mergers, takeovers, CEO fraud etc.). This last step adds time and effort, but avoids trading/value traps.
How Do We Do?
Even without this last labour-intensive step, our method performs. Here is a 7.5 month paper trading exercise of 136 pairs over 432 trades during 2025:
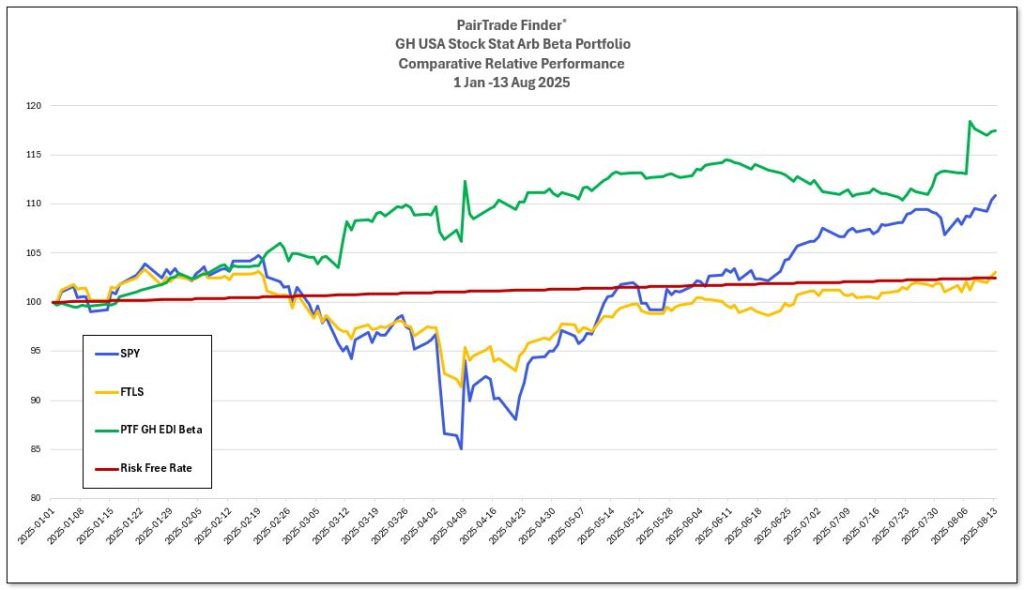
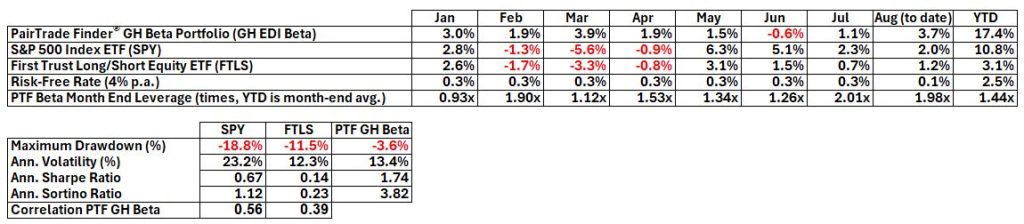
The chart above illustrates the fund’s equity curve alongside two widely followed benchmarks: SPY (S&P 500 ETF) and FTLS (First Trust Long/Short Equity ETF). Despite the absence of a news filter (i.e. this is raw stat arb), the fund consistently outperformed both benchmarks. That +17.4% in 7.5 months equates to over a +28% annualised return. With a -3.8% Maximum Drawdown vs. -18.8% for the S&P 500.
Read all about our live trading here.
What More Complex Models Do Differently
More advanced approaches—like regression or Kalman filters—introduce two concepts:
- Hedge ratio (β): how much of one asset to hold versus the other
- Spread (or residual): the adjusted gap between the two prices after accounting for that ratio
In simple terms:
- The hedge ratio determines how to balance the trade
- The spread measures how far the pair has deviated from that balance
Kalman filters take this a step further by continuously updating that balance over time.
What the Research Says About Kalman Filters
Academic research does show that Kalman-based approaches can improve the statistical properties of pairs trading strategies.
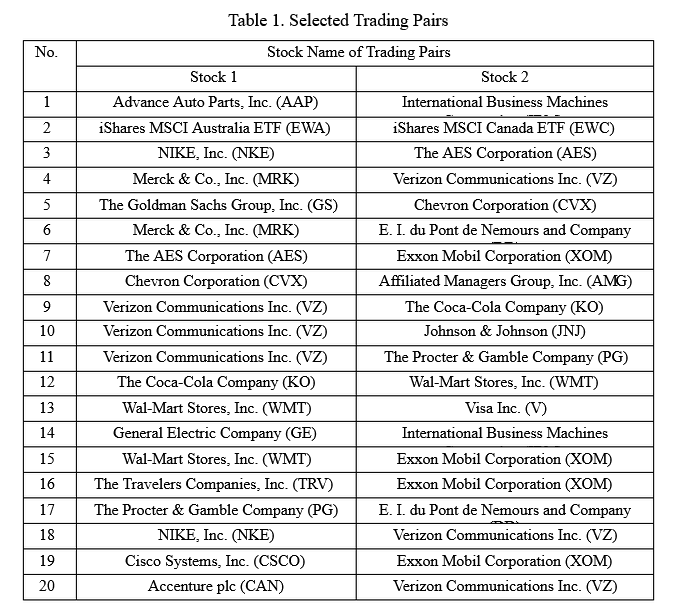
Dynamic hedge ratios can reduce systematic risk and improve risk-adjusted returns in backtests (1). Here are the results of one study that tested 20 mega-cap pairs over a five year period from 2012-2017 using both a standard approach and the Kalman filter approach. The pairs were as follows:
Here were the reported improvements in overall return:
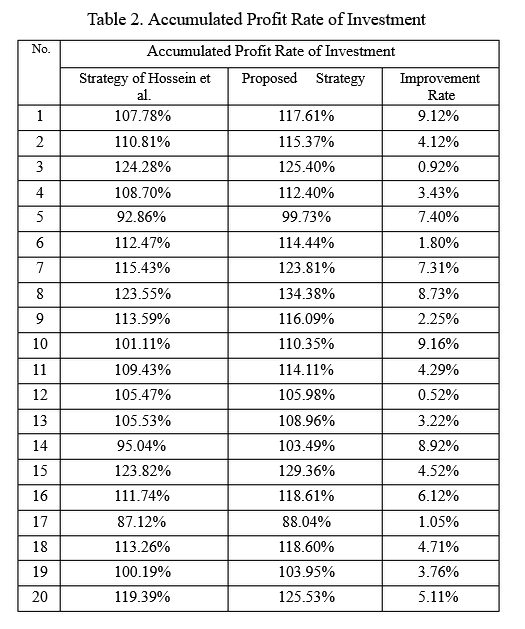
We have some question marks regarding the pairs selected as they don’t seem to demonstrate fundamental similarity in many cases (Goldman Sachs, beta currently 1.34 vs. Chevron beta currently 0.66, Nike, beta 1.29 vs. Verizon, beta 0.28, all in widely different sectors and industries). Likely that heterogeneity makes their long/short profitability potential more exposed to market regime change (those are massive differences). Almost as if the author had chosen pairs with widely divergent reactions to market regime changes to maximise the effect of Kalman filter mitigation. Remember, PairTrade Finder®’s approach is to pair stocks that are fundamentally in the same business and are beta-similar.
Nevertheless, using this pair set, the author demonstrates between a 0% and 9% improvement in total profitability per pair over the five-year period. In many instances the filters have a significant impact, in others, not much at all. Nice to have, but hardly groundbreaking. And, for the added complexity, is it robust? (Source: Cointegration Approach for the Pair Trading based on the Kalman Filter, January 2023, Jia Yu, Fukuoka University)
Another study has shown Kalman-based models also tend to produce more stable and mean-reverting spreads compared to static approaches (2). More advanced variations can further improve signal quality in controlled studies.
However, an important point is often overlooked: most of these results are based on simulations or backtests that assume minimal transaction costs.
The Gap Between Backtests and Real Trading
Kalman filters improve precision, but they also introduce:
- more frequent hedge adjustments
- more trading activity
- greater sensitivity to short-term noise
In live markets, this translates into:
- higher transaction costs
- more slippage
- increased execution complexity
There is a large body of evidence in trading research showing that higher turnover strategies often see their edge significantly reduced after costs. For example, the study with the heterogeneous examples above states clearly:
“transaction costs are not included in this work, so for future studies, researchers can take transaction costs into account when structuring trading strategies to bring them closer to the actual situation.”
Indeed.
So while Kalman filters can appear superior in theory, the real-world advantage is often much smaller than expected—and in some cases disappears entirely.
Why PairTrade Finder® Takes a Different Approach
PairTrade Finder® makes a deliberate design choice:
- Use cointegration and correlation to find the right pairs
- Use performance metrics to validate them
- Use simple execution to trade them efficiently
Instead of trying to perfectly optimise every trade, it prioritises:
- stability over precision
- scalability over optimisation
- robustness over model complexity
Equal-dollar positioning acts as a practical approximation of neutrality, without the need for constant rebalancing.
When Kalman Filters Can Add Value
This does not mean Kalman filters are without merit.
They can be useful when:
- relationships are clearly changing over time
- you are trading a smaller number of high-conviction pairs
- transaction costs are low relative to expected edge
Many advanced traders use them as a second layer, rather than a replacement for simpler approaches. Common production mitigations can also be applied, including (a) tuning process/measurement noise to reduce churn, (b) smoothing / infrequent updates (e.g., update beta but only trade if it moves beyond hysteresis), (c) hybrid use where Kalman recalibrates hedge ratios periodically rather than continuously.
That is a lot of added complexity.
Bottom Line
PairTrade Finder® is not avoiding advanced methods—it is applying them selectively.
- Cointegration and correlation ensure statistical and business-fundamentals validity
- Performance metrics provide real-world validation
- Simple execution ensures consistency and scalability
Kalman filters can improve theoretical precision, but they also increase:
- turnover
- complexity
- execution risk
This creates a clear trade-off:
more precision vs. more friction
PairTrade Finder® is designed to sit on the right side of that trade-off—delivering most of the edge, with far less complexity, in a way that can be executed consistently in live markets.
Happy trading!
Geoff & The PairTrade Finder® Team
(2) https://www.sciencedirect.com/science/article/abs/pii/S0165176521001191
