


Most retail trading strategies depend on direction — and direction is the one thing nobody can predict consistently. By contrast, market-neutral pair trading offers an alternative: trades constructed not on whether a market rises or falls, but on the relationship between two fundamentally related assets. As a result, when that relationship temporarily diverges, mean reversion offers a measurable, repeatable edge.
Your Shortcut to Market-Neutral Pair Trading Success
This May, after another quarter of research, recalibration, and statistical validation, we are releasing the May 2026 Vintage of our Top 50 USA Stock Pair Stars. Notably, we are also pairing the release with a full live, 95-day out-of-sample forward test that demonstrates how the methodology behaves in real markets, with every signal taken unfiltered.
Here are the headline results from the live forward test (3 February – 8 May 2026):
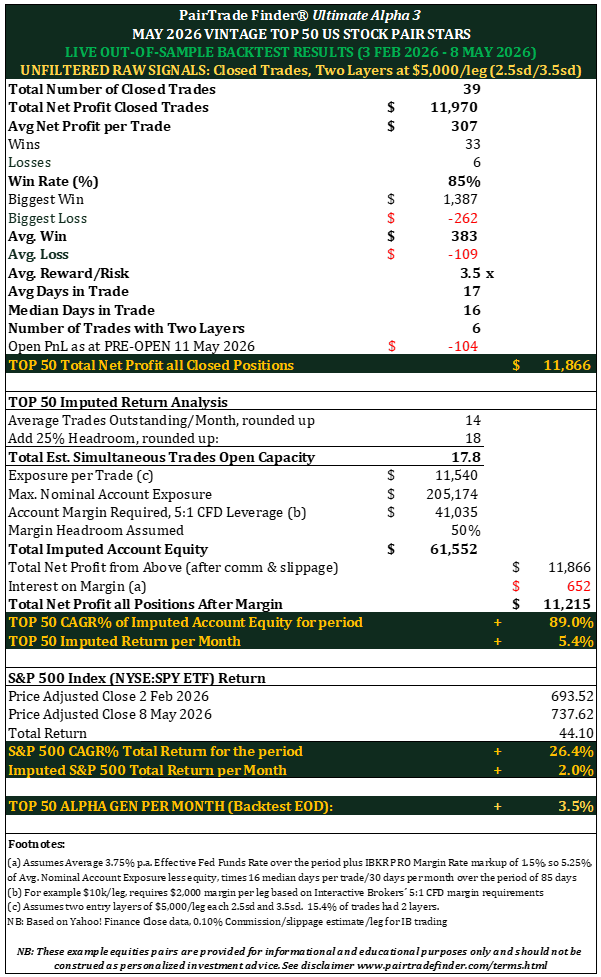
- +18.7% indexed return over 95 days
- 85% win rate (33 winners, 6 losses)
- 3.5x reward-to-risk
- +5.4% imputed monthly return on equity
- +3.5% monthly alpha vs S&P 500
Against comparators over the same window: the S&P 500 (SPY) returned +6.0%, and the Barclay Hedge Equity Market Neutral Index — the recognised institutional benchmark for this category — returned approximately +0.2%. Three benchmarks, three very different stories. The broad market produced 6%; the wider market-neutral category produced essentially nothing; PairTrade Finder®’s systematic methodology delivered +18.7% while remaining genuinely uncorrelated to broad markets.
The supporting three-year in-sample backtest (3 February 2023 to 2 February 2026) provides the consistency check:
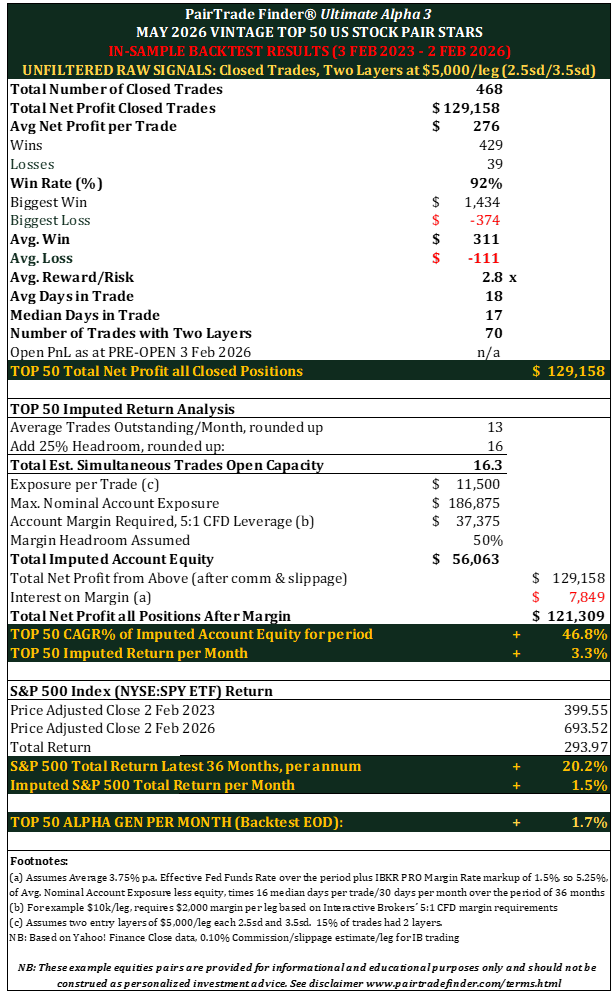
- 468 closed trades across all 50 pairs
- 92% win rate (429 wins, 39 losses)
- +46.8% CAGR on imputed account equity, after margin interest
- versus S&P 500 +20.2% per annum over the same window
- versus Barclay Hedge EMN Index approximately +8.9% per annum
Each figure represents a modelled observation, not a guarantee. Moreover, what earns trust is not any single result but the consistency between in-sample and out-of-sample: a 92% in-sample win rate that drops only to 85% out-of-sample suggests the methodology generalises beyond its training data rather than overfitting it. That result is exactly for what disciplined quantitative validation aims.
How the Top 50 Is Built
The selection process narrows 12,000+ US-listed equities through six successive filters. Liquidity and market-cap screens reduce the universe to about 2,000 candidates. Same-sector and same-industry-sub-sector pairing logic generates approximately 32,000 candidate pairs. Statistical screens — cointegration via Augmented Dickey-Fuller (p ≤ 0.10), correlation ≥ 50%, three-year backtest win rate ≥ 70% — combined with fundamental-fit checks narrow that to about 150. Our analysts then hand-select the strongest 50 pairs. They look to ensure diversification across sectors and tickers, with no single-sector or single-ticker overweighting the portfolio.
One pair in six hundred makes the final list. Full details of the universe and filter parameters, plus the underlying signal record, are available HERE.
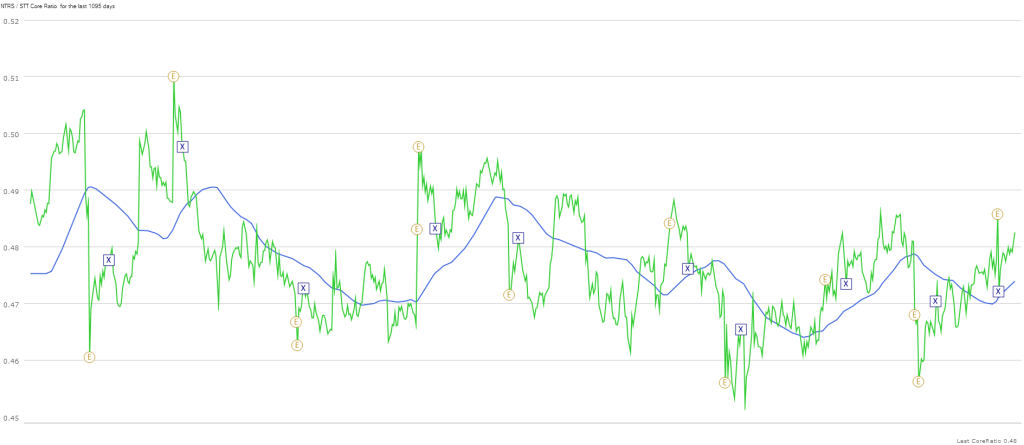
An Example: NTRS / STT
The May 2026 vintage includes Northern Trust Corporation (NTRS) and State Street Corporation (STT) — two US-listed asset-management institutions with combined market cap of approximately $71 billion and decades of price co-movement. Over three years of backtesting, the pair generated 10 closed trades, 90% wins, a 3.0% maximum drawdown, and 6.5% annualised return at the single-pair level. Highly cointegrated and correlated pair. Below we chart the trade entries and exits over the last three years, along with the PnL, in PairTrade Finder® Ultimate Alpha 3:
NTRS/STT Daily Core Ratio vs. 60-Day Moving Average, Entries & Exits Marked
NTRS/STT 3-Year Profit & Loss, 10 Trades
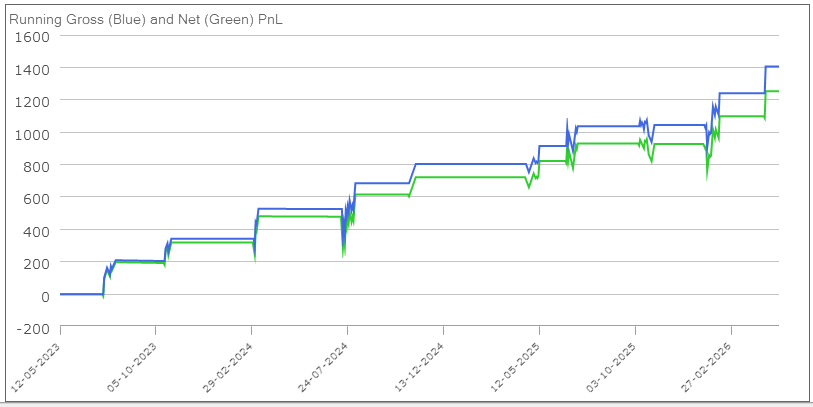
Multiply a steady, modest pair-level return across 50 diversified pairs running in parallel, and the vintage-level numbers above emerge naturally.
Integrating the May Vintage
Existing subscribers can integrate the new set instantly. Go to System Preferences → Autoload tab → “Autoload US Equities Pairs.” The May 2026 Vintage will download directly to your PairTrade Finder® Ultimate Alpha 3 platform from our servers.
Not yet a subscriber? Sign up here.
The Broader View
Markets reward discipline far more reliably than they reward prediction. A market-neutral pair trading approach does not try to time bull or bear regimes. It aims to repeatedly capture small, statistically defensible mispricings between fundamentally related equities, regardless of which way the broader market moves. Over time, those small edges compound — and the resulting equity curve looks much less like the S&P 500 and much more like the curve shown above.
The May 2026 vintage reflects that philosophy. It is preparation, not prediction.
PairTrade Finder® | Equilibria Technologies Ltd. Systematic Trading Technologies for the Market-Neutral Mind. 👉 www.pairtradefinder.com
NB: The example equities pairs in PairTrade Finder® are provided for informational and educational purposes only and should not be construed as personalized investment advice. It should not be assumed that trading using the parameters demonstrated by the Software will be profitable and may result in losses. Please see full Terms & Disclaimer here.
